A few weeks ago I was pulled into a production support thread. A self-managed Redis cluster — a 4-core, 32GB box, nothing exotic — was showing rising latencies. The instinctive first move was to check CPU. It read 50%.
Fifty percent, on a machine with four cores, is the kind of number that makes you look elsewhere. Half the machine is sitting idle. Surely Redis isn't the bottleneck.
Except it was. And the question that came out of that thread stuck with me: how do you actually know, ahead of time, when a Redis instance needs to scale — and whether "scale" means a bigger box or more of them?
I didn't have a confident answer. So I built a benchmark rig and hammered it with real traffic until it genuinely broke — twice, deliberately. First a standalone instance, to isolate the core mechanism without extra variables. Then a real primary/replica pair, because that's how almost everyone actually runs Redis in production, and I wanted to know whether the same numbers still hold once a replica is in the picture.
The 50% CPU number was never the right number
Here's the thing almost nobody's dashboard accounts for: Redis executes commands on a single thread. Not "mostly single-threaded" — by default, one thread does all the work of reading your request, running your command, and writing the response. GCP, AWS, your laptop, it doesn't matter how many cores the box has. Redis will use, at most, one of them for the thing that actually matters.
So on that 4-core box, Redis's ceiling isn't 400% CPU (all four cores) — it's 100% of one core. Which is 25% of the host's total capacity. A host-level CPU chart showing "50%" on a 4-core machine could mean Redis's own single core is already maxed out while something else on the box is also busy — the average across four cores just happens to land on 50%. CPU% on the host is the wrong metric for Redis capacity, full stop. You need CPU as a fraction of one core, specifically the core Redis's command loop runs on. Everything else in this post is what happens once you start watching the right number — on a standalone instance first, then on a primary/replica pair.
Part 1: proving it on a standalone instance
I didn't want to write "trust me, watch main-thread CPU" without actually watching it happen. So I built a small benchmark rig — a dedicated Redis instance and a separate load generator — and drove three different traffic shapes at it with YCSB:
- Read-heavy (95% reads / 5% writes) — a cache-like pattern
- Write-dominant (90% writes / 10% reads) — session stores, counters
- Mixed (50/50) — shopping carts, most "normal" app traffic
For each one, I climbed a load staircase — more concurrent requests, more throughput — until Redis genuinely couldn't keep up, watching server-side metrics via Prometheus the whole way.
The three ceilings
| Traffic shape | Sustained ceiling | Main-thread CPU at ceiling |
|---|---|---|
| Read-heavy | ~25,000 ops/sec | ~93-99% |
| Mixed | ~26,200 ops/sec | ~85-97% |
| Write-dominant | ~28,700-29,000 ops/sec | ~75-85% |
Same hardware, three different ceilings. Writes are cheaper for Redis to execute than reads in this record shape (writing a hash field is less work than reading all of them back), so write-heavy traffic gets more headroom before the single core saturates. There's no single "Redis can do N ops/sec" number — it depends entirely on what your traffic actually looks like. Which is exactly why watching CPU-of-one-core, not a fixed throughput target, is the metric that survives your traffic mix changing.
The trap: Redis's own latency metric doesn't warn you either
I assumed, going in, that if CPU alone wasn't the smoking gun, at least Redis's own reported latency would climb as a warning sign. It doesn't. I pushed main-thread CPU from 58% to 93% — most of the way to saturation — and Redis's own server-side p99 latency moved from 30 microseconds to 33. Basically flat.
That's because Redis only times how long a command takes to run, not how long it sat waiting in line first. Once the single core is busy, new requests queue up — and that queueing delay, the thing that actually makes your application feel slow, is invisible to Redis's own metrics. If your alerting watches Redis's reported latency, it will not warn you in time.
Does Redis actually fall over, or just get slow?
One more thing worth knowing before you decide how urgently to react to any of this: I pushed all three traffic shapes to 4x their sustained ceiling and held it there for two and a half minutes, to see what "ignoring the warning" actually costs.
Redis did not fail. No errors, no dropped connections, nothing crashed. It queued everything and kept serving, just slower.
But "just slower" isn't the same story for every traffic shape:
| Traffic shape | p99 latency at ceiling | p99 latency at 4x overload |
|---|---|---|
| Read-heavy | 23.7ms | 138.8ms (~6x) |
| Mixed | 21.6ms | 134.3ms (~6x) |
| Write-dominant | 19.6ms | 20.7ms (barely moves) |
Read-heavy and mixed traffic hit a wall and the tail latency explodes. Write-dominant traffic degrades far more gracefully. If your service is read-heavy, missing the warning threshold is a much bigger deal than if it's write-heavy — worth knowing which kind of traffic you're actually running before you decide how much margin to leave yourself.
Part 2: does a real primary/replica pair change the story?
A standalone instance is the clean way to prove a mechanism, but it's not how most people actually run Redis — there's usually a primary taking writes and one or more replicas serving reads, so the primary stays free. So I rebuilt the rig as a real primary/replica pair (same hardware class as Part 1, dedicated 2-vCPU cores on both sides — a shared-core instance size caused enough host-placement noise on its own to be a confound, worth bumping past before trusting any of the numbers below) and ran the same three traffic shapes again, this time with reads routed to the replica and writes to the primary — the actual read/write split most people configure — each step held for ten minutes for stable readings.
The finding: a replica's CPU isn't just its own read traffic
A replica's main-thread CPU is doing two jobs at once — serving the reads you send it, and continuously applying the stream of writes replicated from the primary — and the second job doesn't show up anywhere in your read-traffic numbers. Using the read-heavy staircase to work out roughly how much CPU a given read volume alone should cost, the write-dominant staircase tells a different story:
| Replica's own read load | CPU predicted from reads alone | CPU actually observed | Writes being replicated to it |
|---|---|---|---|
| 1,500 reads/sec | ~6.5% | 40.5% | 13,500/sec |
| 2,500 reads/sec | ~11% | 38.9% | 22,500/sec |
| 3,000 reads/sec | ~13% | 45.5% | 27,000/sec |
The replica's CPU sits ~30 percentage points above what its own read traffic would predict, every time — and it tracks the volume of writes being replicated to it, not the reads it's actually serving. Here's the full picture, host CPU% against Redis's own main-thread CPU% for both sides, plus achieved throughput and server-side latency, across the whole staircase:
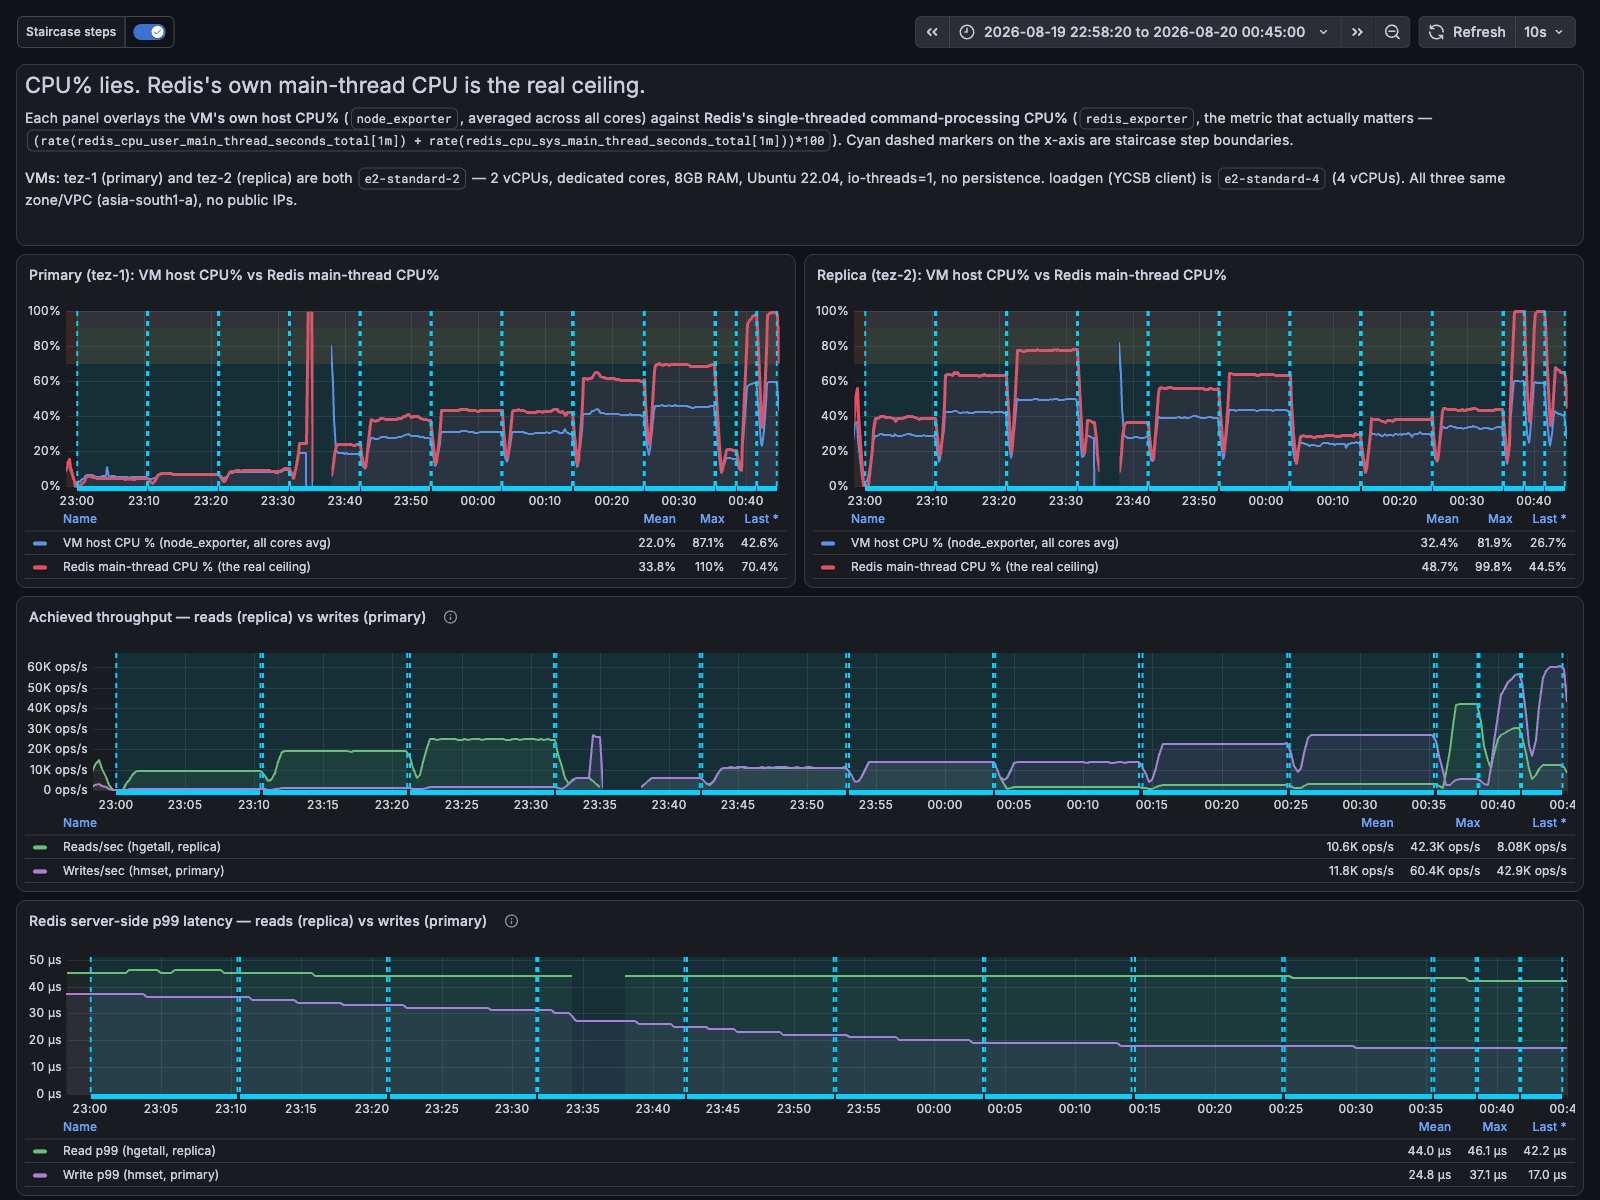
You can explore this dashboard yourself — here's a live, interactive snapshot of the exact run above, panel-by-panel.
Overload and latency: the same two findings, more pronounced
Pushed to 4x overload, the split topology behaved exactly like Part 1 — no failures, just queueing, on both the primary and the replica. And the latency trap was, if anything, worse: Redis's own server-side p99 for reads stayed inside 42-46 microseconds across the entire staircase, including 4x overload — under 10% variation start to finish — while what the client actually experienced told a completely different story:
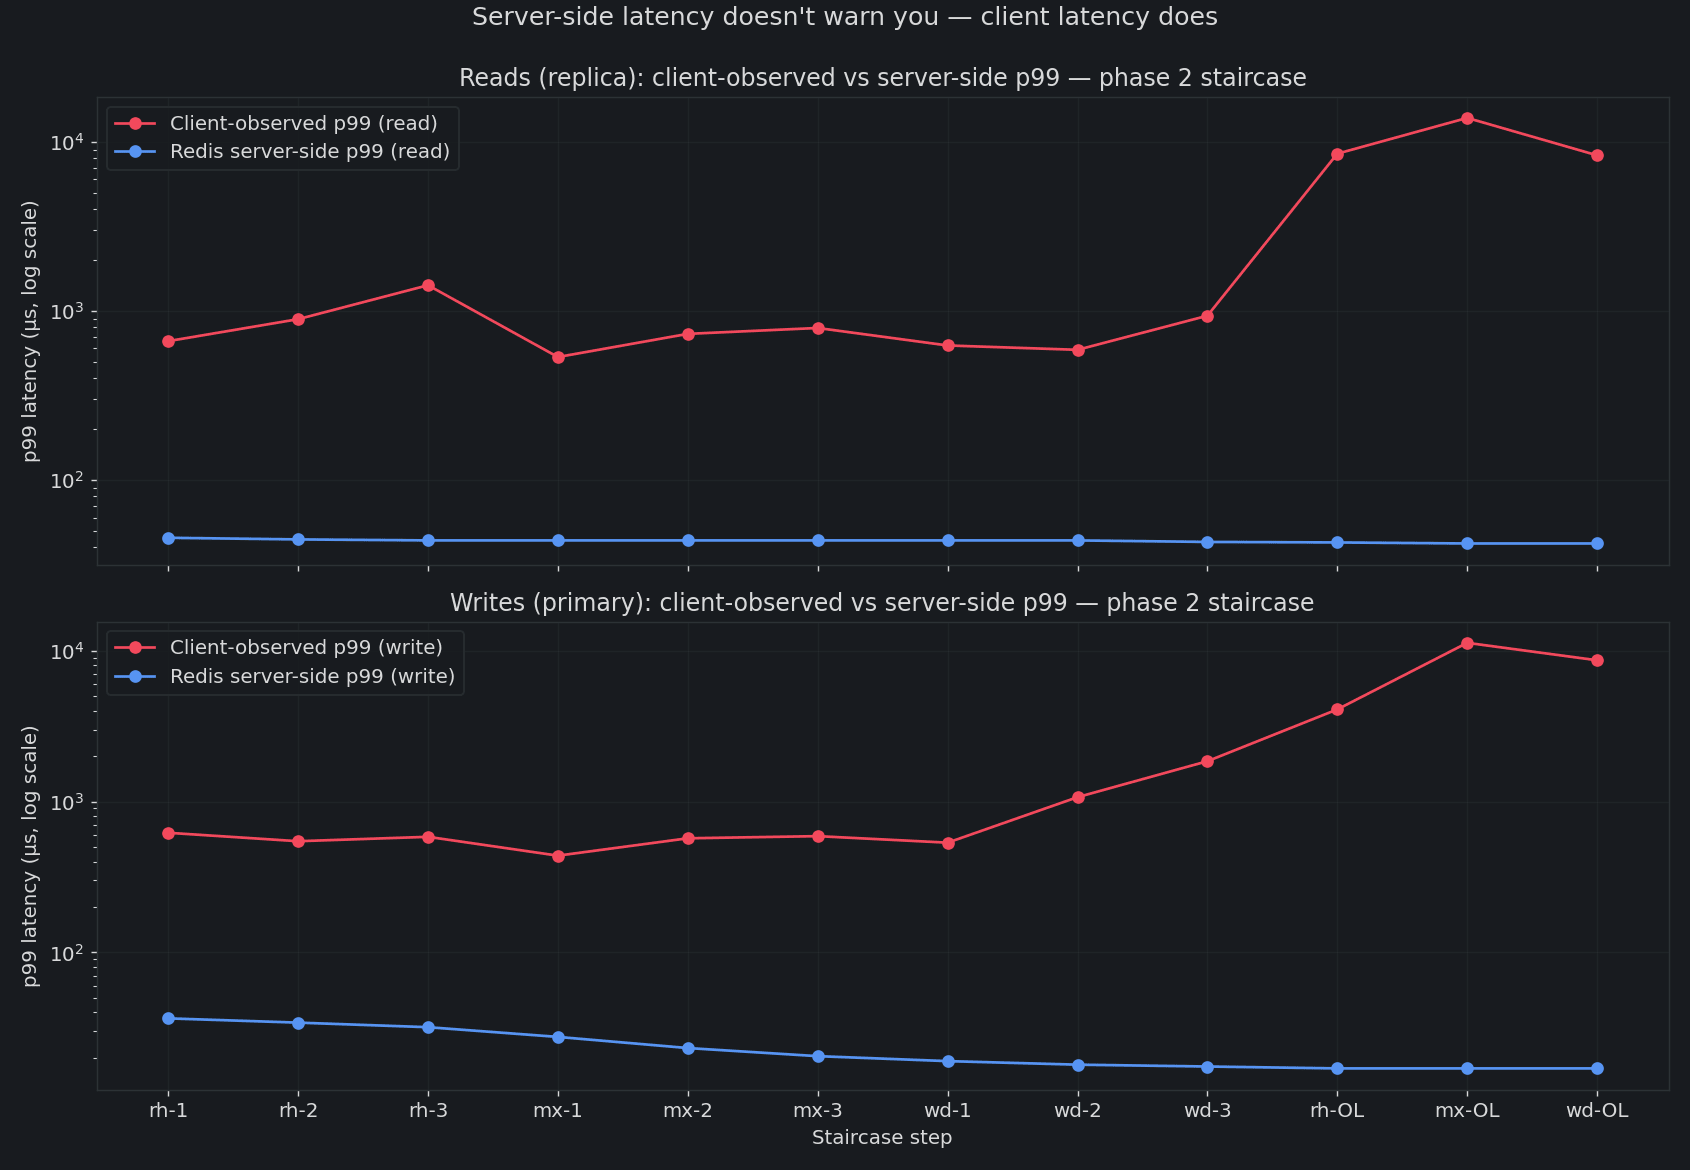
Client-observed p99 for reads went from 663µs at the lightest step to 8,503µs under 4x overload — a 13x increase that Redis's own metrics never showed even a hint of.
So: when do you scale up, and when do you scale out?
This is the part that actually answers the original question — for both a standalone instance and a primary/replica pair.
Watch this metric:
rate(redis_cpu_user_main_thread_seconds_total[1m])
  + rate(redis_cpu_sys_main_thread_seconds_total[1m])
— a fraction of one core, sourced from redis_exporter. Alert at
70% (start planning) and 90% (act now) on a standalone instance.
Not host CPU%. Not Redis's own latency numbers.
If you're running a primary/replica pair, don't reuse those same thresholds on the replica. Watch primary and replica CPU as two separate series, and watch the primary's write rate alongside replica CPU — a replica CPU spike with flat read traffic means the write rate went up, not the read rate. And when sizing read replicas for capacity, budget for the replication-apply tax, not just the read QPS you expect to send them — a replica never gives you a full standalone instance's worth of read headroom.
When the alert fires, let the main-thread number decide — don't reach for a bigger box by reflex. Since the bottleneck is one thread, adding vCPUs to the same instance does almost nothing for that number.
That said, main-thread CPU isn't the only reason to size up: a growing dataset pushing memory limits, or background work like persistence (RDB/AOF), backups, monitoring agents, and TLS termination competing for headroom, can justify a bigger box even with main-thread usage nowhere near the ceiling. Let the main-thread metric — not a blanket "always scale out" — decide which lever to pull.
When the main-thread number itself is the constraint, the fix is scaling out:
- Read-heavy traffic → add read replicas. Reads are the expensive operation; offloading them frees the primary's one core to focus on writes — just budget for the replication-apply tax above, not the raw read QPS alone.
- Write-heavy or mixed traffic → shard (Redis Cluster). Replicas don't relieve write load; splitting the keyspace across multiple single-core shards does.
- One caveat worth taking seriously: sharding assumes reasonably even key access. If your traffic has hot keys, one shard can still hit the same ceiling alone while the others sit idle — worth checking your real access pattern before assuming sharding buys you a clean multiple of the single-instance ceiling.
That's the answer I wish I'd had in that support thread: the CPU number everyone was staring at wasn't lying about the box — it was answering a question nobody was actually asking.
What this actually cost
I built the entire benchmark rig — provisioning both topologies, writing the YCSB workloads, wiring up Prometheus and Grafana, running every staircase, and pulling the findings together — working with Claude Code. Here's the actual bill for the whole exercise:
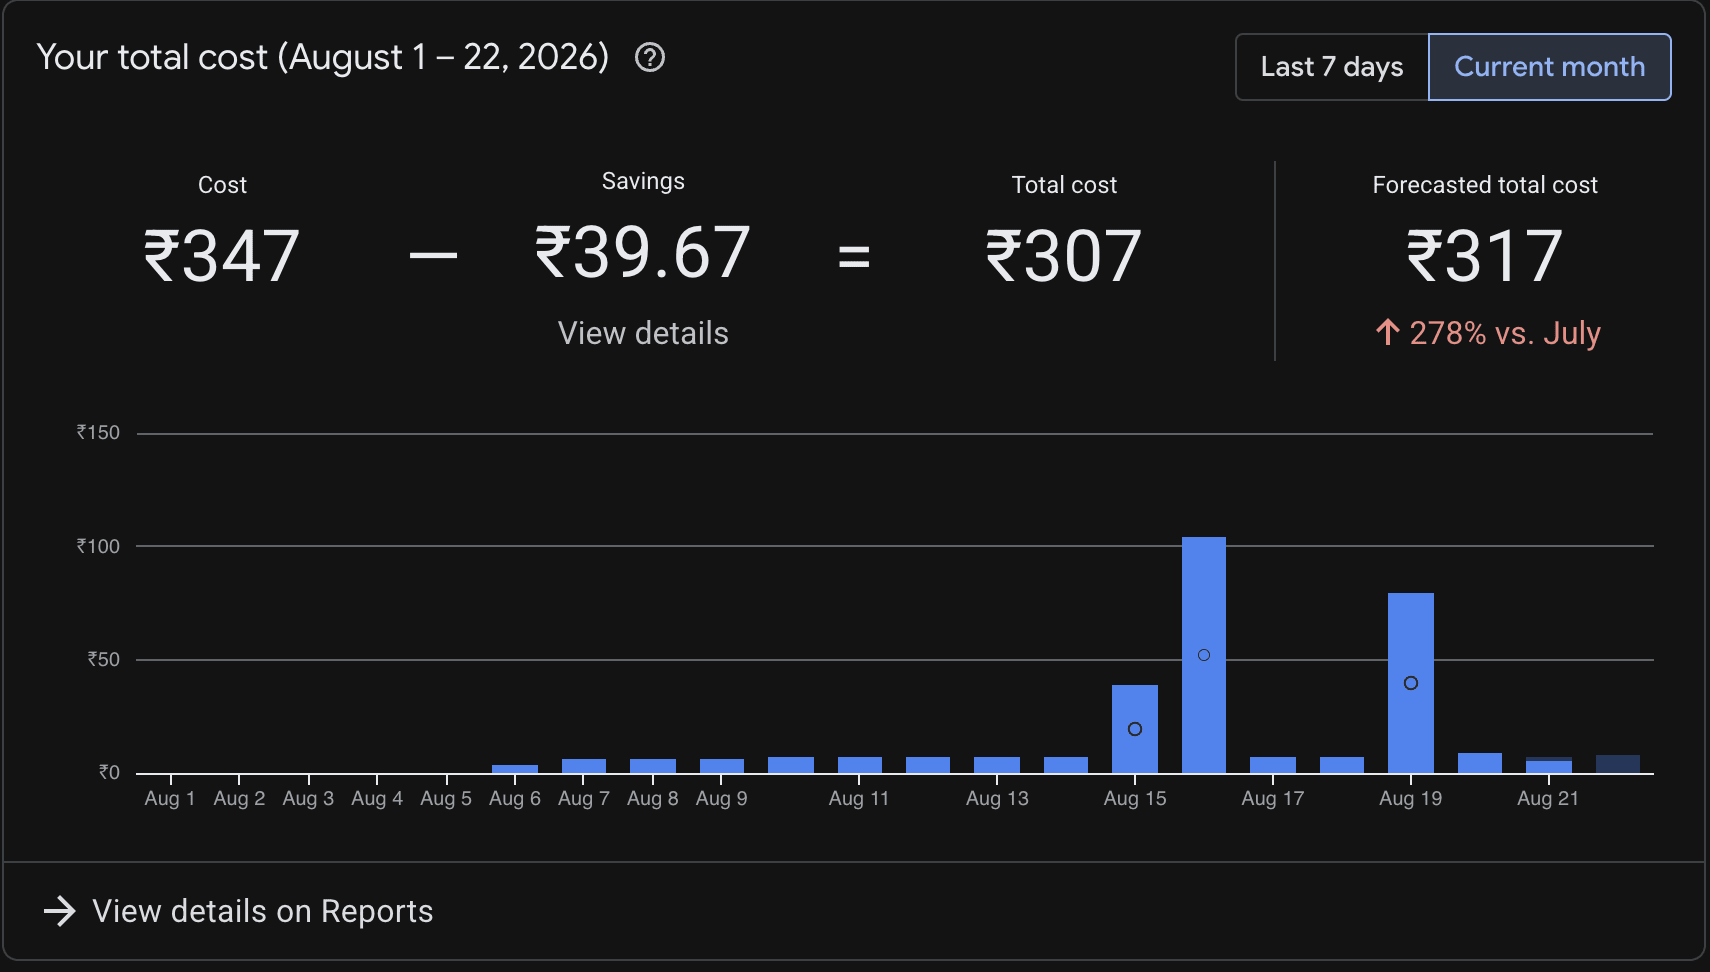
Around ₹300 for the compute this specific investigation used, on top of a Claude subscription I already pay for regardless. You don't need a research budget to go verify something like this for your own stack — just a weekend and curiosity about the number your dashboard is actually showing you.
Digging deeper
The full write-up — every workload's complete load staircase for both the standalone instance and the primary/replica pair, the raw numbers, the methodology, and the actual Prometheus alerting rules I ended up with — is here as a GitHub Gist.